Trading summary
Trading for a Living Summary: Key Ideas and Takeaways
Read a practical summary of Trading for a Living by Dr. Alexander Elder, including key takeaways, lessons, and useful ideas.
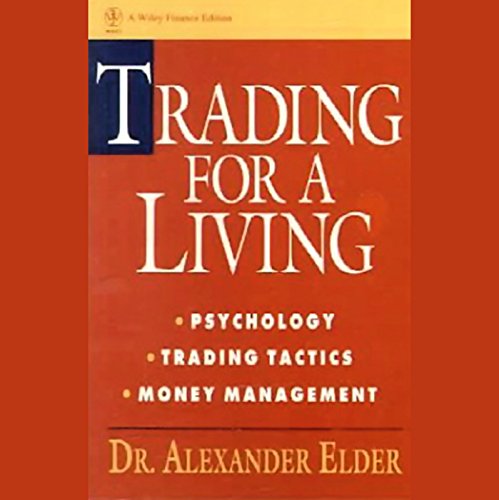
Author: Dr. Alexander Elder
Category: Trading
Published: 1993
Pages: 289
Key Takeaways
- **The Three M's:** Success stands on three legs—Mind (psychology), Method (analysis), and Money (risk management). Remove any one leg and the stool collapses.
- **The Amateur vs. Professional Focus:** Amateurs obsess over Method (the Holy Grail indicator). Professionals focus on Mind and Money—discipline and survival come first.
- **Certainty vs. Probability:** The market doesn't guarantee outcomes. You can execute perfectly and still lose. Your job is to play a probability game with detachment, not predict the future.
- **Greed, Fear, Euphoria:** Greed blinds you to risk. Fear makes you freeze or exit early. Euphoria (after winning streaks) leads to overconfidence and the drawdown that wipes you out.
- **The Trading Journal:** Record every trade's setup, numbers, and your emotional state. Review weekly for 'psychological leaks'—moving stops, boredom trades, hope-based decisions.
- **Triple Screen Trading System:** Filter trades through 3 timeframes. Screen 1 (Weekly) = Trend direction. Screen 2 (Daily) = Pullback entry. Screen 3 = Trailing stop order for precise timing.
- **The Force Index & Elder-Ray:** Force Index combines volume + price to measure conviction. Elder-Ray reveals hidden bull/bear power by comparing price to the 13-EMA 'value' line.
- **The 2% Rule (Iron Law):** Never risk more than 2% of total account equity on a single trade. This is the 'Shark Barrier'—5 losses at 2% = 9% drawdown (recoverable). 5 losses at 10% = 40% (devastating).
- **Position Sizing Formula:** Shares = (Account × 0.02) ÷ (Entry - Stop). The wider your stop, the smaller your position. You don't size based on profit hopes, but on allowed loss.
- **Process Over Outcome:** A good trade follows the rules (even if it loses money). A bad trade breaks rules (even if it profits). Making money on bad trades reinforces destructive habits.
About This Summary
The Architecture of Consistency: A Definitive Masterclass on Mind, Method, and Money
By Dr. Alexander Elder (Persona)
Introduction: The Three Pillars and the Trader's Triple Barrier
Welcome to the operating theater. I use this term deliberately because trading, like surgery, requires precision, emotional detachment, and a rigorous adherence to protocol. If you walk into this arena seeking excitement, validation, or a quick solution to your financial problems, the market will not only disappoint you; it will dismantle you.
The financial markets are a harsh environment. They are structured to transfer money from the chaotic many to the disciplined few. Most aspiring traders spend years searching for the "Holy Grail"—a magical indicator or a secret algorithm that will predict the future with 100% accuracy. Let me save you years of frustration: It does not exist.
Success in the markets is not a single secret; it is a tripod. It is a stool that stands on three legs. If you remove any one of these legs, the stool collapses, and you fall. These three legs are the Three M's:
- Mind: The psychological discipline to follow your rules and manage your emotions.
- Method: The system of analyzing prices and generating signals.
- Money: The risk management formulas that prevent a string of losses from destroying your account.
The Trader's Triple Barrier represents the internal conflicts that prevent success.
- The first barrier is ignorance of the method (thinking you can guess).
- The second barrier is ignorance of risk (betting the farm).
- The third, and most difficult barrier, is ignorance of the self (allowing fear and greed to dictate actions).
The amateur focuses entirely on the Method. The professional focuses on the Mind and the Money. In this masterclass, we will surgically dissect these three pillars. We will move from the psychology of the individual to the tactics of the chart, and finally to the mathematics of survival.
Pillar I: Mind – Trading Psychology
We begin here because this is where the battle is won or lost. You can buy a winning system from a vendor, but you cannot buy the discipline to follow it. The market is not a physical entity; it is a mass psychologist. It represents the collective hopes, fears, and madness of millions of participants. To trade successfully, you must first master the universe between your ears.
The Fundamental Conflict: Certainty vs. Probability
The primary psychological barrier to trading success is the human craving for certainty. In our daily lives, we are trained that if we work hard and follow the rules, we get a specific result. If you drive a car and turn the wheel left, the car goes left.
In the market, you can perform the perfect analysis, execute the perfect entry, and still lose money. This creates a cognitive dissonance that destroys the amateur. When the market moves against you, the untrained mind reacts with the "fight or flight" mechanism.
- Fight (Anger): You average down, adding to a loser, screaming that the market is wrong.
- Flight (Fear): You sell at the bottom, paralyzed by the loss, or you refuse to take a valid signal because you are afraid of losing again.
You must accept a harsh truth: The market does not care about you. It does not know you exist. It is not trying to hurt you, nor is it trying to help you. It is a stream of data. Your job is not to predict the future with certainty, but to execute a probability game with detachment.
The Enemy Within: Greed, Fear, and Euphoria
Your emotions are not your friends in the trading room. They are saboteurs.
- Greed: This is not just the desire for money; it is the desire for easy money. It manifests as chasing a trend that has already extended, ignoring your stop-loss targets because "it might go higher," or oversizing your position. Greed blinds you to risk.
- Fear: Fear strikes when you have lost confidence in your method. It causes you to exit winning trades too early (leaving money on the table) or to stare at a perfect setup and freeze.
- Euphoria: This is the most dangerous emotion. After a winning streak, you feel invincible. You believe you have "solved" the market. You stop journaling. You double your size. This is always—always—followed by the drawdown that wipes you out.
The Solution: The Trader's Journal and Self-Analysis
How do we cure these emotional diseases? We treat them like an addiction. In Alcoholics Anonymous, the first step is admitting you are powerless over alcohol. In trading, you must admit you are powerless over the market. You can only control yourself.
The primary tool for this is not a chart, but a Trading Journal.
Amateurs look at their account balance to judge their day. Professionals look at their journal. Your journal must record three things for every trade:
- The Setup: Why did you buy? (Technical reason).
- The Numbers: Entry, Stop, Target, Size.
- The Emotional State: How did you feel entering? How did you feel exiting? Were you sweating? Were you bored?
Self-Criticism is vital. You must review your journal at the end of every week. You are looking for Psychological Leaks.
- Did you move your stop loss because you hoped the market would turn? That is a leak.
- Did you take a trade just because you were bored? That is a leak.
Emotional Discipline: Process over Outcome
You must decouple your emotional well-being from the result of any single trade.
- A Good Trade is one where you followed your plan, managed your risk, and executed perfectly. It is a good trade even if it lost money.
- A Bad Trade is one where you broke your rules, took too much risk, or acted on impulse. It is a bad trade even if it made money.
Making money on a bad trade is the worst thing that can happen to a beginner, because it reinforces bad habits. Discipline is the ability to ignore the result of the last trade while preparing for the next one.
Pillar II: Method – Trading Tactics
Once your mind is calm and your ego is checked at the door, you need a Method. A method is a set of objective rules for analyzing the market. It cuts through the noise and identifies the path of least resistance.
My approach relies on the concept that markets are complex and move in multiple timeframes simultaneously. A daily chart may look bullish, while the weekly chart is hitting resistance, and the hourly chart is overbought. To navigate this, we use the Triple Screen Trading System.
The Triple Screen Trading System
The Triple Screen system was designed to solve the problem of conflicting indicators. Trend-following indicators (like Moving Averages) are useless in ranges, and Oscillators (like RSI) give false signals in strong trends. The Triple Screen combines them by filtering trades through three distinct timeframes.
The Rule of Five: Whatever your intermediate (trading) timeframe is, the long-term timeframe should be five times longer.
- Day Traders: Intermediate = 5 or 10 minutes; Long-term = 30 or 60 minutes.
- Swing Traders: Intermediate = Daily; Long-term = Weekly.
Screen 1: The Tide (Market Trend)
Timeframe: Long-term (e.g., Weekly). Goal: Identify the dominant trend. Tool: The MACD Histogram or a 13-week Exponential Moving Average (EMA). Action: If the Weekly MACD Histogram ticks up (or price is above the sloping EMA), the tide is rising. You can only go long. If it ticks down, the tide is falling. You can only go short.
Screen 2: The Wave (Market Correction)
Timeframe: Intermediate (e.g., Daily). Goal: Identify a move against the tide to find a value entry. Tool: An Oscillator (Stochastic, Force Index, or Williams %R).
Action:
- If the Weekly trend is UP, look for the Daily oscillator to become Oversold and turn up. This is a buying opportunity within an uptrend.
- If the Weekly trend is DOWN, look for the Daily oscillator to become Overbought and turn down. This is a shorting opportunity within a downtrend.
Screen 3: The Ripple (Entry Timing)
Timeframe: Short-term (or purely price action on the Intermediate chart). Goal: Pinpoint the entry. Tool: Trailing Buy-Stop or Sell-Stop orders.
Action:
- Buying: If the Weekly is Up and Daily is Oversold, place a Buy-Stop one tick above the high of the previous day. If price moves up, you are filled. If price drops, lower the order to one tick above the new day's high. You do not buy until the market creates momentum in your direction.
Triple Screen Implementation Matrix
| Screen | Function | Indicator Example | Weekly Trend UP (Bull) | Weekly Trend DOWN (Bear) | |--------|----------|-------------------|------------------------|--------------------------| | First Screen | The Tide (Trend) | MACD Histogram (Weekly) | Slope is UP. Go Long Only. | Slope is DOWN. Go Short Only. | | Second Screen | The Wave (Correction) | Force Index / Stochastic (Daily) | Daily falls below zero (Oversold). | Daily rises above zero (Overbought). | | Third Screen | The Ripple (Entry) | Trailing Stop Orders | Place Buy-Stop above prev. high. | Place Sell-Stop below prev. low. |
Elder's Essential Tools
While the Triple Screen provides the structure, we need specific tools to measure the power of the bulls and bears. I recommend two primary instruments: The Force Index and The Elder-Ray.
#### 1. The Force Index
Volume is the fuel of the market. Price is the vehicle. Most indicators only look at the vehicle. The Force Index combines both to measure the conviction of a move.
Formula: $Force\ Index = Volume_{today} \times (Close_{today} - Close_{yesterday})$
Interpretation:
- The 13-Day EMA of Force Index: This smooths out the noise. When the 13-day Force Index is above zero, the bulls are in control. When below, bears are in control.
- The 2-Day EMA of Force Index: This is used for Pinpointing Entries (Screen 2). In an uptrend, buy when the 2-Day Force Index drops below zero (a pullback on low volume or weak conviction). In a downtrend, sell when the 2-Day Force Index spikes above zero.
#### 2. The Elder-Ray (X-Ray of the Market)
This indicator reveals the hidden power of bulls and bears by comparing price to value. We define "value" as the 13-day Exponential Moving Average (EMA).
- Bull Power: $High - 13\ EMA$ — Measures the ability of bulls to push price above the average value.
- Bear Power: $Low - 13\ EMA$ — Measures the ability of bears to push price below the average value.
Application:
- Buy Signal: The Trend (13-EMA) is rising, but Bear Power is negative (price dipped below value) and is starting to rise back toward zero. Even better is a Bullish Divergence (prices hit a new low, but Bear Power traces a higher low).
- Short Signal: The Trend is falling, but Bull Power is positive and starting to fall. Look for Bearish Divergence (prices hit a new high, but Bull Power makes a lower high).
Pillar III: Money – Risk Management
We have covered the Mind and the Method. Now we arrive at the pillar that ensures your survival. You can have the psychological discipline of a monk and the analytical skills of a Nobel laureate, but if you do not manage your money, you will go broke.
Mathematical ruin is a statistical certainty for those who gamble. Risk management is not about making money; it is about staying in the game long enough for your method to work.
The Iron Rule: The 2% Rule
This is the single most important rule in this entire guide. Violate it, and you are a gambler, not a trader.
The Rule: Never risk more than 2% of your total account equity on a single trade.
Many amateurs think this means they can buy shares worth 2% of their account. This is wrong. It means if the trade hits your stop-loss, the amount of money lost must not exceed 2% of your equity.
Most professionals actually risk less—often 1% or 0.5%. But 2% is the absolute "Shark Barrier." It protects you from a string of losses. If you risk 10% per trade, a string of 5 losses wipes out 40% of your capital (due to compounding). If you risk 2%, a string of 5 losses reduces your capital by roughly 9%. You can recover from a 9% drawdown. You cannot easily recover from a 40% drawdown.
Position Sizing: The Calculation
You do not decide how many shares to buy based on how much money you want to make. You decide based on how much you are allowed to lose.
The Formula:
$Position\ Size\ (Shares) = \frac{Account\ Equity \times 0.02}{Entry\ Price - Stop\ Price}$
Example:
- Account Size: $50,000
- Maximum Risk (2%): $1,000
- Stock: XYZ Corp
- Entry Price: $50.00
- Stop Loss: $48.00 (Based on technical support, not a random number)
- Risk Per Share: $2.00
$Position\ Size = \frac{1000}{2} = 500\ Shares$
If you can only afford to lose $1,000, and each share carries $2 of risk, you are allowed to buy 500 shares. If your stop loss needs to be wider (e.g., at $45), your risk per share is $5, and you can only buy 200 shares.
The wider the stop, the smaller the position size. This mechanism automatically prevents you from taking massive risks in volatile markets.
Stops and Targets: The Mechanical Exit
Hope is not a strategy. You must have a hard exit plan before you enter.
- Protective Stops: A stop-loss is not a suggestion. It is a fire door. You place it at a level where, if the price hits it, your technical analysis is proven wrong. Do not use "mental stops." The market moves faster than your fingers. Place the hard order in the system.
- Profit Targets: Greed will tell you to hold forever. The Method tells you where the resistance lies. You should take profits (or at least partial profits) at technical barriers (e.g., the upper channel line, a Fibonacci extension, or a previous resistance zone).
- The "No-Regret" Policy: If you sell at your target and the price keeps going up, you do not regret it. You followed the plan. You banked the money. You look for the next trade.
Conclusion: Synthesis & The Road to Professionalism
We have traversed the anatomy of a successful trader. We started with the Mind, realizing that we are our own worst enemies and that discipline is the antidote to emotional self-destruction. We built the Method, utilizing the Triple Screen system to filter out noise and the Elder-Ray to x-ray the market's internal power. Finally, we fortified our survival with Money, applying the 2% Rule to ensure that no single mistake can take us out of the game.
Trading is not a hobby. It is a business. If you treat it like a hobby, it will pay you like a hobby—which is to say, it will cost you money. If you treat it like a business, it will pay you like a business.
The professional trader does not wake up thinking, "I will make $5,000 today." The professional wakes up thinking, "I will follow my rules today."
The Professional Trader's 10-Point Checklist
- Preparation: Have I downloaded the data and updated my charts? Is my mind calm and free of outside stress?
- Market Tide: What is the Weekly MACD/Trend doing? (Screen 1). Am I trading in the direction of the tide?
- The Wave: Has the Daily Oscillator pulled back against the trend to offer value? (Screen 2).
- The Setup: Is there a clear technical pattern (e.g., Bullish Divergence, Support bounce)?
- The Trigger: Have I placed a mechanical Stop order to enter only if momentum turns? (Screen 3).
- The Stop-Loss: Have I identified the technical invalidation point? Is the hard stop order ready to be placed immediately upon entry?
- The Reward-to-Risk: Is the potential profit target at least 2x the distance to the stop-loss?
- The 2% Rule: Have I calculated the position size so that if the stop is hit, I lose less than 2% of my equity?
- The Journal: Have I written down the setup and my feelings before clicking the button?
- The Surrender: Do I accept that this trade may lose, and am I at peace with that outcome because I followed the rules?
If you can answer "Yes" to all ten, you are trading. If you miss one, you are gambling. The choice is yours.
Good trading.