Finance summary
The Little Book That Still Beats The Market Summary: Key Ideas and Takeaways
Read a practical summary of The Little Book That Still Beats The Market by Joel Greenblatt, including key takeaways, lessons, and useful ideas.
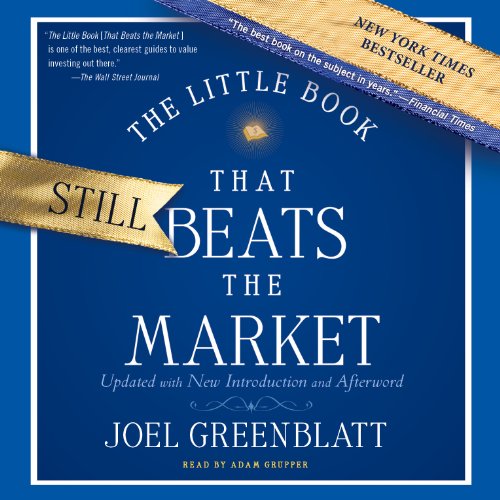
Author: Joel Greenblatt
Category: Finance
Published: 2010
Pages: 192
Key Takeaways
- The Magic Formula combines two metrics: Earnings Yield (cheapness) and Return on Capital (quality) to find undervalued high-quality businesses
- Earnings Yield = EBIT / Enterprise Value - superior to P/E because it accounts for debt and uses operating earnings
- Return on Capital = EBIT / (Net Working Capital + Net Fixed Assets) - measures true business efficiency without debt manipulation
- Exclude financials, utilities, and micro-caps from your screening universe
- Build a portfolio of 20-30 stocks using staggered entry over 9-12 months to avoid timing risk
- Hold every stock for exactly one year, then sell and replace with current top-ranked stocks
- The formula can underperform for 1-3 years - this is a feature, not a bug, as it creates the opportunity
- Your biggest enemy is psychology: fear, greed, and the need to feel like you're 'doing something'
- Complexity is the illusion of control - simple systems beat complex ones over time
- Commit to the strategy for a minimum of 5 years; anything less is gambling
About This Summary
The Magic Formula Masterclass: Buying Good Companies at Cheap Prices
A Guide for the Rational Investor
Introduction: Exploiting Irrationality
Welcome to the only finance class you will ever actually need. If you have spent any time watching CNBC, reading analyst reports, or listening to your brother-in-law brag about a cryptocurrency that sounds like a sneeze, you have likely come to a terrifying conclusion: The stock market makes absolutely no sense.
And you would be right.
Most of the time, the market is efficient. It prices things correctly. But "most of the time" isn't "all of the time." Frequently, the market behaves like a manic-depressive fellow we'll call Mr. Market. Sometimes he is euphoric and wants to sell you stocks for ten times what they are worth. Other times, he is despondent and wants to sell you the keys to a Ferrari for the price of a Ford Fiesta.
The vast majority of investors—including the "professionals" in $5,000 suits—fail to beat the market averages over the long run. Why? Because they are human. They chase heat. They buy what has gone up, and they sell what has gone down. They try to predict the unpredictable (interest rates, oil prices, the next iPhone). They overcomplicate the simple.
The Magic Formula Investing (MFI) strategy is designed to save you from yourself. It is a methodical, logic-based system that ignores the noise and focuses on two things, and two things only:
- Is this business good?
- Is this business cheap?
That's it. It sounds too simple to work, doesn't it? We are conditioned to believe that to make money in a complex world, we need complex models. We think we need to analyze macroeconomic trends, interview CEOs, and possess a PhD in mathematics. But the data tells a different story.
This guide is not about gambling. It is about value investing stripped down to its absolute chassis. It is the industrial-grade version of what Warren Buffett does, adapted for those of us who don't have the time to read 500 annual reports a year.
The philosophy is simple: If you stick to buying above-average companies at below-average prices, and you do it consistently over a long period, you will end up with above-average results. The Magic Formula is the tool that finds these companies for you. It exploits the market's systematic irrationality—its tendency to overreact to short-term bad news—and turns it into your long-term profit.
But be warned: The math is easy. The discipline is excruciatingly hard.
Pillar I: The Two Core Ratios
To understand the Magic Formula, you must understand the engine that drives it. We are not looking at price charts, and we don't care about "momentum." We are looking at the financial guts of a business.
We rank companies based on a combination of two specific factors. We don't just want "cheap" junk (that's a value trap). We don't just want "good" companies (they are usually too expensive). We want the best combination of both.
To do this, we discard the traditional metrics you see on Yahoo Finance—like the P/E ratio or ROE—and use two far superior metrics.
Ratio 1: Earnings Yield (Measuring Cheapness)
The first question a rational businessman asks is: "If I buy this business, how much money will I make back on my investment?"
Wall Street usually uses the Price-to-Earnings (P/E) ratio to measure cheapness. If a stock costs $20 and earns $1 per share, the P/E is 20.
The P/E ratio is flawed.
Why? Because it doesn't account for debt or tax rates.
Imagine two houses in the same neighborhood:
- House A costs $1 million.
- House B costs $1 million.
Are they the same price? What if I told you House A comes with a $5 million mortgage you have to assume, while House B has $500,000 in cash in the safe? The sticker price (Market Cap) is the same, but the actual price to own the house is wildly different.
To fix this, the Magic Formula uses Earnings Yield, calculated using EBIT and Enterprise Value.
The Formula:
$\text{Earnings Yield} = \frac{\text{EBIT}}{\text{Enterprise Value}}$
Let's break down why this is superior.
1. The Numerator: EBIT (Earnings Before Interest and Taxes)
We use EBIT, also known as operating income, rather than "Net Income." Net Income is "bottom line" earnings, but it is often distorted by tax rates (which change) and interest payments (which depend on debt levels, not business quality).
EBIT allows us to view the earnings power of the business before the capital structure (debt vs. equity) gets in the way. It is the raw cash the machine produces.
2. The Denominator: Enterprise Value (EV)
Enterprise Value is the theoretical purchase price of the entire business. It is calculated as:
$\text{EV} = \text{Market Capitalization} + \text{Total Debt} - \text{Excess Cash}$
- Market Cap: The price of all shares.
- Plus Debt: If you buy a company, you take on its debt. That is a cost to you.
- Minus Cash: If the company has cash in the bank, that reduces the net price you pay. It's like buying a wallet for $50 that has a $10 bill inside. You really only paid $40.
The Logic:
By dividing EBIT by Enterprise Value, we get the Earnings Yield. This percentage tells us: "If I bought the whole company today, assuming its debt and keeping its cash, what is the percentage return on my money in the first year?"
A 10% Earnings Yield means for every $100 you spend buying the company, it generates $10 in operating profit. We want this number to be as high as possible.
Ratio 2: Return on Capital (Measuring Quality)
Now that we know the stock is cheap, we need to know if the business is actually good. Is it a lemonade stand that costs $5 to run and makes $6? Or is it a software company that costs $1 to run and makes $10?
Wall Street typically uses Return on Equity (ROE) or Return on Assets (ROA).
ROE and ROA are flawed.
ROE can be manipulated by loading up on debt. If you have very little equity because you borrowed massive amounts of money, your ROE looks sky-high even if the business is mediocre. ROA is flawed because it counts "intangible" assets like Goodwill, which doesn't reflect the capital actually required to run the business day-to-day.
To fix this, the Magic Formula uses Return on Capital (ROC), calculated using EBIT and Tangible Capital Employed.
The Formula:
$\text{Return on Capital} = \frac{\text{EBIT}}{\text{Net Working Capital} + \text{Net Fixed Assets}}$
Let's dissect this.
1. The Numerator: EBIT
Again, we use pre-tax, pre-interest operating earnings. We want to know how good the operations are, regardless of how the CEO decided to finance them.
2. The Denominator: Tangible Capital Employed
This is the money actually tied up in the business to keep the lights on and the inventory moving. It consists of:
- Net Working Capital: (Receivables + Inventory) - (Payables). This is the cash tied up in waiting for customers to pay you and buying stuff to sell, minus the interest-free loans your suppliers give you.
- Net Fixed Assets: Property, Plant, and Equipment (PP&E). The physical trucks, factories, and computers needed to operate.
We purposely exclude "Goodwill" and "Intangibles" (historical premiums paid for acquisitions) because they are sunk costs. We want to know: "For every dollar of actual capital invested in the store, how much profit does it spit out?"
The Logic:
We are looking for a high Return on Capital.
If a company has an ROC of 50%, it means that to build a new factory or open a new store cost $1 million, and that store earns $500,000 a year. That is a phenomenal business. It has a "moat"—a competitive advantage that prevents competitors from stealing those returns.
If a company has an ROC of 8%, it's barely beating a savings account. We don't want those.
The Synthesis: The Ranking System
Here is the genius of the Magic Formula. It doesn't look for the cheapest stock (which might be a dying business). It doesn't look for the best business (which is likely too expensive).
It ranks them.
Imagine a universe of 3,500 stocks.
- Rank by Cheapness (Earnings Yield): The cheapest stock gets a rank of 1. The most expensive gets 3,500.
- Rank by Quality (Return on Capital): The best business gets a rank of 1. The worst gets 3,500.
- Combine the Ranks: Add the two numbers together.
Example:
- Company A: Great business (Rank 5 for Quality) but expensive (Rank 1,000 for Cheapness). Combined Score: 1,005.
- Company B: Terrible business (Rank 2,000 for Quality) but very cheap (Rank 10 for Cheapness). Combined Score: 2,010.
- Company C (Magic Formula Stock): Very good business (Rank 60 for Quality) and very cheap (Rank 40 for Cheapness). Combined Score: 100.
Company C wins. It offers the best statistical probability of outperformance because you are buying a high-quality machine at a discount price. The Magic Formula simply buys the top stocks with the best combined scores.
Pillar II: Implementation & Mechanics
Understanding the math is useless if you don't know how to execute the trade. The implementation of MFI is mechanical. It removes your brain from the equation, which is good, because your brain is trying to sabotage you with fear and greed.
Here is the step-by-step mechanism.
1. The Universe and The Filter
We start with a broad list of stocks (e.g., the largest 3,500 US-traded companies), but we must apply crucial filters before ranking them.
Filter A: Market Capitalization Floor
We generally exclude companies with a market cap below $50 million (or $100 million).
Why? Liquidity. If you try to buy a tiny micro-cap stock, your buying alone might drive the price up. Furthermore, the data on extremely small companies is often unreliable.
Filter B: Exclude Financials (Banks, Insurance)
Why? The metrics we use (EBIT/Enterprise Value and Return on Capital) do not work for banks. A bank's "inventory" is money. Their debt is effectively their raw material. An "Earnings Yield" based on Enterprise Value makes no sense when liabilities are deposits.
Action: Remove all stocks classified as Financials.
Filter C: Exclude Utilities
Why? Utilities are regulated. Their profits are capped by the government. We are looking for companies that might be mispriced, where earnings can grow significantly. Utilities are bond-proxies, not growth machines.
Action: Remove all Utilities.
Filter D: Exclude ADRs (Optional but Recommended)
Why? American Depositary Receipts are foreign companies trading in the US. Accounting standards vary wildly in other countries. To keep the data clean and comparable, we stick to domestic US stocks.
2. The Buying Process
You do not simply take your life savings, run the screen, and buy the top 30 stocks on a Tuesday morning. That is a recipe for bad luck. We must average our entry into the market.
The Portfolio Size:
You aim to hold a portfolio of 20 to 30 stocks.
Why? The Magic Formula works on averages. Individual stocks will blow up. Some will go to zero. Some will triple. You need a basket large enough that the statistics can work in your favor, but small enough that you aren't just buying the index.
The Staggered Entry:
- Month 1: Run the Magic Formula screen. Buy the top 5 to 7 stocks.
- Month 3 or 4: Run the screen again. Buy the top 5 to 7 stocks that you don't already own.
- Repeat: Continue this process every few months until you have accumulated a full portfolio of 20–30 stocks. This usually takes 9 to 12 months.
Why? This prevents you from buying at a single market peak. It spreads your "luck" across different market conditions.
3. The Holding Period and Selling
This is the most rigid part of the system. You are not a trader. You are a systematic investor.
The Rule: Hold every stock for one year.
The Rebalancing Strategy:
After holding a stock for one year, you sell it. Period.
- It doesn't matter if it's down 50%. Sell it.
- It doesn't matter if it's up 200% and you love the CEO. Sell it.
The Tax Optimization Tweak:
If you want to be truly sophisticated, use the calendar to help your taxes:
- Losers: Sell stocks that have lost money a few days before the one-year mark. This allows you to claim a short-term capital loss for tax purposes.
- Winners: Sell stocks that have gained money a few days after the one-year mark. This allows you to pay the lower long-term capital gains tax rate.
The Reload:
After you sell a batch of stocks (e.g., the 5-7 stocks you bought a year ago), you take that cash, run the Magic Formula screen again, and buy the new top 5-7 stocks currently on the list.
Repeat this forever.
Pillar III: The Psychological Edge
If you have read this far, you are likely thinking: "This sounds incredible. High returns, logical math, clear steps. Why doesn't everyone do this? Why isn't every fund manager on Wall Street using this formula?"
The answer lies in Pillar III. This is not about math. It is about psychology.
The greatest barrier to the success of the Magic Formula is not the market, the economy, or inflation. It is you.
The Patience Problem
Here is the brutal truth: The Magic Formula will not work all the time.
In fact, it can underperform the S&P 500 for one, two, or even three years in a row.
This is not a bug; it is a feature. If the Magic Formula worked every single month or every single year, everyone would use it. Hedge funds would arbitrage the opportunity away, and the premium would disappear.
It works specifically because it creates periods of excruciating underperformance.
Imagine you are following the formula:
- Year 1: The market is up 10%. You are down 5%. You feel stupid.
- Year 2: The market is up 15%. You are flat. Your friends are bragging about their tech stocks. You feel like an idiot.
- Year 3: The market is flat. You are down 2%.
At this point, 95% of investors will quit. They will say, "The formula is broken," or "Value investing is dead." They will sell their cheap, good companies and buy whatever expensive tech stock is popular.
And that is exactly the moment the Magic Formula takes off.
Historically, the formula makes up for all that lost ground and then some in sudden, violent bursts of outperformance. But you have to be in the room to benefit from it. You cannot time when the value realization will happen.
Professional fund managers cannot do this. If a professional underperforms for two years, they get fired and lose their clients. They are forced to "closet index"—buying the same stocks as everyone else to avoid looking stupid.
You have the ultimate advantage: You cannot fire yourself. If you have the iron stomach to ignore the market for three years and trust the logic of the arithmetic, you can beat the professionals.
The Illusion of Complexity
We live in a world that equates difficulty with value. We think that to get a 20% return, we must work twice as hard as we do for a 10% return.
The Magic Formula proves this false.
- You don't need to listen to earnings calls.
- You don't need to analyze management's body language.
- You don't need to predict interest rates.
These activities give you the illusion of control. They make you feel like you are "working." But often, that extra information just introduces bias. You fall in love with a story. You ignore the numbers because you like the product.
The Magic Formula is cold. It is ruthless. It doesn't care about the story. It only cares about the Earnings Yield and the Return on Capital. It forces you to buy companies that look scary—companies that are in the news for the wrong reasons, companies that have been beaten down.
Buying a company that just hit a 52-week low feels terrible in your gut. But your gut is not an investing tool. Your gut is designed to keep you from getting eaten by a lion. In the stock market, your gut will get you slaughtered.
Stick to the math. Ignore the noise.
Conclusion & Final Mandates
The Magic Formula is not about magic. It is about the systematic application of common sense. It buys high-quality businesses (High ROC) when they are on sale (High Earnings Yield). It bets on the mean reversion of profitability and the eventual sanity of the market.
It is simple, but it is not easy. It requires a discipline that most humans simply do not possess. If you can master your emotions, the math will take care of the rest.
Here is your final checklist for execution. Print this out. Tape it to your monitor.
The 10 Commandments of MFI
- The Universe: Start with the largest 3,500 US-traded companies.
- The Minimums: Eliminate stocks with a market cap under $50 million (preferably $100M+).
- The Exclusions: Strictly eliminate all Utilities and Financials (Banks/Insurance).
- The Screen: Rank the remaining stocks by Earnings Yield and Return on Capital.
- The Selection: Select the top 5 to 7 companies with the best combined ranking.
- The Diversification: Repeat step 5 every 2–3 months until you own a portfolio of 20 to 30 stocks.
- The Hold: Hold each stock for exactly one year.
- The Sale: Sell losers just before the one-year mark (tax loss); sell winners just after the one-year mark (capital gains).
- The Re-Roll: Use the proceeds from sales to buy the current top-ranked stocks to replace them.
- The Vow: Commit to this strategy for a minimum of 5 years. Anything less is gambling.
The market is irrational. You don't have to be. Good luck.