Trading summary
Trade Like a Stock Market Wizard Summary: Key Ideas and Takeaways
Read a practical summary of Trade Like a Stock Market Wizard by Mark Minervini, including key takeaways, lessons, and useful ideas.
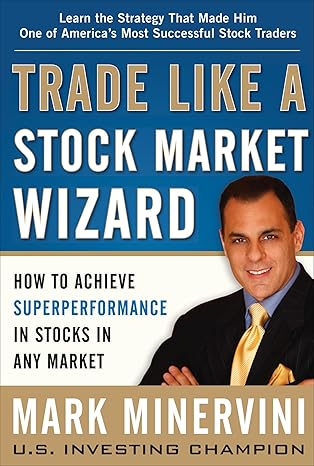
Author: Mark Minervini
Category: Trading
Published: 2013
Pages: 352
Key Takeaways
- **The Four Stages:** Every stock cycles through Neglect (Stage 1), Advancing (Stage 2), Topping (Stage 3), and Declining (Stage 4). Only buy in Stage 2—the others are dead money or traps.
- **Buy High, Sell Higher:** Abandon bargain hunting. What's cheap gets cheaper; what's expensive gets more expensive. Superperformance comes from riding momentum, not catching falling knives.
- **The Trend Template:** 8 non-negotiable rules—price above 50/150/200-day SMAs, 200-day rising, 30%+ off lows, within 25% of highs, RS Rank > 70. If it fails any, skip it.
- **Relative Strength (RS) Ranking:** Not RSI. Compare stock performance vs. S&P 500 over 12 months. Demand RS > 80. You want Usain Bolt, not the guy jogging in the park.
- **Volatility Contraction Pattern (VCP):** The ideal entry pattern. Pullbacks get shallower, volume dries up, sellers exhaust. Buy the pivot breakout on 40-100% volume spike.
- **Fundamentals Matter:** Look for 25-50%+ EPS growth (best have 100-300%), 20%+ sales growth, and earnings acceleration quarter over quarter. Earnings surprises are massive catalysts.
- **Industry Group Strength:** 50% of a stock's move is correlated to its sector. Buy the strongest stocks in the strongest groups. Wolf pack confirmation increases odds.
- **The 1% Risk Rule:** Never risk more than 1-1.25% of total account equity per trade. Position size = Risk $ ÷ Risk per share. You can invest 12% but only risk 1%.
- **7-8% Max Stop Loss:** Set it and never move it down. If a breakout fails immediately, cut at 3-4%. Hope is not a strategy. Losers average losers; winners average winners.
- **Mathematics of Ruin:** Lose 10% → need 11% to recover. Lose 50% → need 100%. Protecting capital IS the job. Assume every trade is a loser until proven otherwise.
About This Summary
The SEPA® Masterclass: Engineering Superperformance
A Definitive Blueprint for Capturing Stage 2 Alpha
Author: Mark Minervini (Simulated) Subject: Specific Entry Point Analysis (SEPA®) Strategy & Risk Management Objective: Total Market Domination via Stage 2 Trend Capture
Introduction: The Four Stages of Stock Price Movement
The Philosophy of Time and Opportunity Cost
Listen to me closely because what I am about to tell you is the difference between an amateur gambler and a professional stock operator. The market does not care about your opinion. It does not care about your valuation models, your gut feelings, or what you heard on CNBC. The market respects one thing and one thing only: Price Action.
Most traders fail because they treat the market like a bargain bin at a discount store. They buy stocks that are falling, thinking they are getting a "deal." In the stock market, what is cheap usually gets cheaper, and what is expensive usually gets more expensive. To generate Superperformance—returns of 100%, 200%, or more in a short period—you must abandon the desire to buy low and sell high. You must learn to buy high and sell higher.
To do this, you must understand the life cycle of a stock. Every equity on the planet cycles through four distinct phases. Your success depends entirely on your ability to ignore three of them and focus 100% of your capital and attention on one specific phase.
Stage 1: The Neglect Phase (Consolidation)
This is the base. The stock is drifting sideways. There is no sustained trend. Volume is drying up, and the stock is largely ignored by the major institutions. The price oscillates around the 200-day moving average.
The Trap: Amateurs buy here because they think they are "getting in on the ground floor."
The Reality: This is dead money. A Stage 1 base can last for months or years. As a superperformance trader, your inventory is cash, and your enemy is lost time. Do not buy in Stage 1. We wait for the breakout.
Stage 2: The Advancing Phase (Accumulation)
This is the only stage that matters. This is where the money is made.
In Stage 2, demand overwhelms supply. Institutions—mutual funds, hedge funds, pension funds—are aggressively accumulating shares. The stock creates higher highs and higher lows. It trades comfortably above its 200-day moving average, and the 200-day is sloping upward.
The Goal: Our entire SEPA® methodology is designed to identify stocks entering or re-entering Stage 2. We want to ride the "line of least resistance" upward.
Stage 3: The Topping Phase (Distribution)
All good things come to an end. In Stage 3, volatility increases. The stock becomes "loose." The steady, rhythmic ascent of Stage 2 is replaced by choppy, erratic behavior. The smart money (who bought in Stage 2) is selling their shares to the late-arriving crowd (the public).
The Warning: If you are holding a stock here, you are playing with fire. The easy money has been made.
Stage 4: The Declining Phase (Capitulation)
This is where accounts are destroyed. The stock breaks below its major support levels. The 200-day moving average turns downward. The stock is in freefall.
The Fatal Error: This is where the amateur averages down, saying, "It can't go any lower." It can. It can go to zero. Never, under any circumstances, buy a stock in Stage 4.
The Golden Rule: If a stock is not in a confirmed Stage 2 uptrend, it does not exist to you.
Pillar I: Technical Screening – The Trend Template
Respecting the Wisdom of Price
Fundamentals tell you what to buy; technicals tell you when to buy. You can have the best earnings story in the world, but if the stock is in a Stage 4 downtrend, you will lose money.
To filter the market down from thousands of noise-makers to the few potential Superperformers, we apply the Trend Template. This is not a suggestion. These are the laws of physics for a growth stock. A stock must meet these criteria to be considered a candidate.
The Trend Template: Non-Negotiable Rules
The following table outlines the absolute minimum technical requirements for a stock to be considered in a healthy Stage 2 uptrend.
| Rule # | The Criterion | The Technical Logic | |--------|---------------|---------------------| | 1 | Price > 150-Day & 200-Day SMA | The stock must be trading above its long-term trend filters. This confirms the long-term trend is not down. | | 2 | 150-Day SMA > 200-Day SMA | The medium-term trend must be stronger than the long-term trend. This indicates positive momentum. | | 3 | 200-Day SMA Trending UP | The 200-day moving average must be sloping upward for at least 1 month (preferably 4-5 months). This confirms institutional accumulation. | | 4 | 50-Day SMA > 150-Day & 200-Day SMA | The short-term trend is leading the long-term trend. This is the definition of acceleration. | | 5 | Price > 50-Day SMA | The stock is strong right now. We do not buy stocks trading below their short-term trend line. | | 6 | Price > 30% above 52-Week Low | Bottom fishing is for losers. We want stocks that have already thrust off the bottom, proving demand exists. (Many winners will be 100%+ off lows). | | 7 | Price within 25% of 52-Week High | Stocks hitting new highs tend to go higher. We want stocks knocking on the door of blue-sky territory, not recovering from a crash. | | 8 | RS Ranking > 70 (Preferably 80/90) | The stock must be outperforming the general market (S&P 500). We want leaders, not laggards. |
Relative Strength (RS): The Elite Separator
Do not confuse the Relative Strength (RS) Ranking with the Relative Strength Index (RSI). I am not talking about an overbought/oversold oscillator. I am talking about comparing the performance of your stock against the S&P 500 over the last 12 months.
A Superperformance stock is an alpha predator. When the market corrects, the Superperformer resists the decline (it trades sideways or tight). When the market turns up, the Superperformer is the first to blast off to new highs.
The Rule: I generally demand an RS Rank of 80 or higher. This means the stock is performing better than 80% of all other stocks in the market. Why would you buy a stock performing better than only 40% of the market? You are looking for Usain Bolt, not the guy jogging in the park.
The Power of the Pivot: The VCP
Once a stock meets the Trend Template and has high Relative Strength, we do not just buy blindly. We must time our entry with laser precision. We look for a specific price consolidation pattern known as the Volatility Contraction Pattern (VCP).
The VCP works on the laws of Supply and Demand.
- The Shakeout: The stock advances, then corrects. Weak holders (who are nervous) sell.
- The Contraction: The stock rallies again, but fails to break out. It pulls back, but this time, the pullback is shallower (less volatility).
- The Squeeze: This process repeats (2 to 4 times). Each pullback becomes tighter. Volume dries up significantly.
Why does this happen? The supply of shares coming to market is being absorbed by strong hands. The sellers are exhausted. The stock becomes "light."
The Pivot Point: This is the buy point. It is the moment the stock breaks above the upper resistance of the tightest portion of the VCP on expanding volume.
- Volume Requirement: On the breakout day, you want to see volume spike 40%, 50%, or even 100% above the average. This confirms institutional participation.
- The "Squat": Sometimes a stock breaks out and reverses immediately. If it closes in the lower half of its range, beware. But if it closes strong, you hold.
Visualizing the VCP: Imagine a tennis ball dropped from a height. The first bounce is high, the second lower, the third lower, until it rolls along the ground. That settling process is what we want to see in price action. We buy when the ball stops bouncing and is kicked forward.
Pillar II: Fundamental Screening – Superior Earnings and Catalysts
The Engine of Growth
If technicals are the steering wheel, fundamentals are the engine. Technicals tell us the stock is moving; fundamentals tell us why it should keep moving.
Institutions do not buy stocks because of a chart pattern. They buy because of earnings, sales, and future growth potential. To capture a move of 100% to 300%, you need the "institutional imperative" behind you. You need a story that justifies higher prices.
1. Earnings Per Share (EPS) and Sales Growth
We are looking for acceleration. We are not looking for steady, boring 5% growth. We want explosive growth.
The Criteria:
- Current Earnings: Look for quarterly EPS to be up at least 25% to 50% year-over-year. The best performers often show earnings up 100% to 300% or more.
- Sales Growth: Earnings can be manipulated via cost-cutting. Sales cannot. You must see top-line revenue growth of 20-25% or more.
- Acceleration: This is key. If earnings were up 10% three quarters ago, 20% two quarters ago, and 35% last quarter, that is acceleration. That is a "Code 33."
- The Surprise Factor: Wall Street models are often wrong. We want companies that beat estimates. A significant earnings surprise is a massive catalyst for a Stage 2 advance.
2. Industry Group Strength
Stocks do not move in a vacuum. Roughly 50% of a stock's price movement is correlated to its industry group.
- Leading Groups: You want to buy the strongest stocks in the strongest sectors. If technology is leading, buy tech. If biotech is leading, buy biotech.
- The Wolf Pack: If you see one semiconductor stock breaking out, check the others. If 3 or 4 are hitting new highs, you have group confirmation. This increases your probability of success dramatically.
3. The Catalyst: The "New" Factor
What is driving this growth? There is almost always a fundamental spark.
- New Product: Think Apple with the iPhone or a biotech with a new FDA-approved drug.
- New Management: A new CEO who turns a sluggish company into a lean machine.
- New Highs: The price itself is a catalyst. A stock hitting a new all-time high has no overhead supply (no bag holders waiting to sell at breakeven). It is "Blue Sky" territory.
Institutional Sponsorship:
- You want to see the number of funds owning the stock increasing.
- Quality over Quantity: I prefer to see a few high-quality funds (funds with a track record of picking winners) initiating positions rather than hundreds of mediocre funds.
- The Trend: Are funds buying or selling? We want to see the number of institutional owners rising over the last few quarters.
Fundamental Synthesis:
We are looking for the intersection of high growth and high relative strength. When a company with 50% earnings growth breaks out of a VCP in a leading sector, you have the recipe for a Superperformer.
Pillar III: Risk Management – Absolute Capital Protection
Survival of the Disciplined
You can master the charts. You can master the fundamentals. But if you do not master risk management, you will eventually blow up your account. It is a mathematical certainty.
My trading philosophy is built on a defensive foundation. I assume every trade I take will be a loser until the market proves me wrong. My job is not to make money; my job is to protect what I have so that when the winners come, I have the capital to exploit them.
The Mathematics of Ruin
Understanding this table is more important than any chart pattern:
- If you lose 10%, you need an 11% gain to get back to even.
- If you lose 20%, you need a 25% gain to get back to even.
- If you lose 50%, you need a 100% gain to get back to even.
Do you know how hard it is to make 100%? If you let a loss get to 50%, you are finished. You are no longer trading for profit; you are working for free just to get back to zero.
The 1% Risk Rule
You must never risk more than roughly 1.0% to 1.25% of your total account equity on a single trade. This does not mean you only invest 1% of your cash. It means if the trade hits your stop loss, the amount of money you lose is only 1% of your total account.
The Calculation:
Let's say you have a $100,000 account.
- Your maximum allowable risk is $1,000 (1%).
- Scenario: You want to buy Stock X at $50.
- Stop Loss: You set your stop at $46 (an 8% technical stop).
- Risk per Share: $4.00.
- Position Size: $1,000 (Risk allowance) ÷ $4 (Risk per share) = 250 shares.
- Total Capital Deployed: 250 shares * $50 = $12,500.
In this example, you invested 12.5% of your portfolio, but you only risked 1% of your equity. If you are wrong, you lose $1,000. You still have $99,000 left to fight another day.
Stop-Loss Discipline: The Line in the Sand
I typically use a stop loss of no more than 7% to 8%. Often, I am out sooner.
The Inviolable Rule: Once you set a stop, you never, ever move it down. You can move it up to protect profits, but never down to accommodate a loser.
Psychology: If you hesitate to sell, you are trading with your ego. The market hits your price, you push the button. No questions asked. No "hoping" it comes back. Hope is not a strategy.
The Fatal Error: Averaging Down
Averaging down (buying more shares as the price drops to lower your average cost) is the behavior of a loser.
The Logic: If you buy at $50 and it goes to $45, the market is telling you that you are wrong. Why would you put more money into a position that is proving you wrong?
The Reality: Losers average losers. Winners average winners. I will only add to a position if it moves up and proves my thesis correct (this is called pyramiding).
The Consequence: Averaging down increases your exposure exactly when you should be decreasing it. It turns a manageable scratch on your arm into a severed artery.
Choke the Loss:
If a stock breaks out and then immediately falls back below the pivot point on volume, I often cut the loss right there. I don't wait for the 7% stop. I cut it at 3% or 4%. Why? Because the breakout failed. The reason I bought is gone. So I am gone.
Conclusion: The Synthesis of Discipline
Execution is Everything
The SEPA® method is not a magic wand. It is a tool. Like a scalpel, in the hands of a surgeon, it saves lives; in the hands of a child, it causes damage.
The difference between the trader who makes 100% a year and the trader who breaks even is not intelligence. It is discipline. It is the ability to sit on your hands during Stage 1 and 3. It is the courage to buy the scary breakouts in Stage 2. And most importantly, it is the iron will to take a small loss before it becomes a catastrophe.
You are building a business. Your inventory is stocks. Your overhead is losses. Keep your overhead low, turn your inventory over quickly, and focus only on the high-demand merchandise.
The 10 Non-Negotiable SEPA Rules Checklist
Print this out. Tape it to your monitor. Do not violate it.
- Trend Check: Is the stock above the 200-day MA, and is the 200-day MA rising? (Stage 2 confirmed).
- Momentum: Is the RS Rank > 70 (ideally > 80)?
- Pattern: Is there a proper VCP or consolidation base (at least 3-4 weeks long)?
- Pivot: Are you buying at the correct pivot point, not chasing extended prices?
- Volume: Is there a volume contraction during the base and a volume spike on the breakout?
- Earnings: Does the stock have EPS/Sales growth of 25%+ or a massive turnaround story?
- Group: Is the stock in a leading industry group?
- Stop Loss: Have you set a hard stop loss at max 7-8%?
- Risk Limit: Is the total risk on this trade less than 1.25% of total account equity?
- Earnings Date: Is an earnings release coming up in the next few days? (Never hold a full position into earnings unless you have a significant profit cushion).